The 50-Period Moving Average Strategy
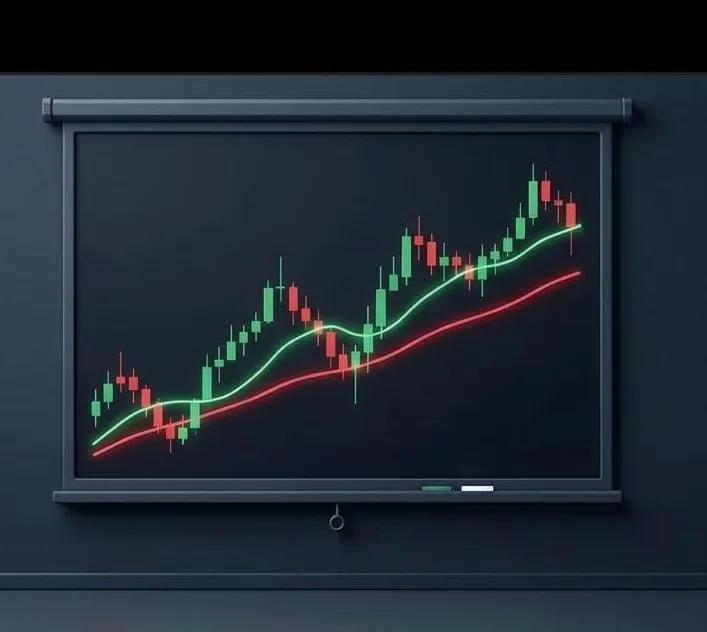
The 50-period simple moving average is one of the most watched lines on any chart. Many traders treat it as a rough boundary between a healthy trend and a market that is losing strength. This sample strategy uses the 50 MA as a trend filter and as a dynamic area where pullbacks may end, not as a magic level.
Why this setup
The 50 MA is slow enough to ignore minor noise and fast enough to react to a change of direction within a few weeks on a daily chart. When price holds above a rising 50 MA, buyers have usually been in control; when it holds below a falling one, sellers have. The idea is to trade only in the direction of the slope and, instead of chasing stretched moves, to wait for price to come back to the average. Because so many participants watch the same line, reactions near it are sometimes cleaner than at random prices, but that is a tendency, not a rule.
Entry rules
- Confirm that the 50 MA has sloped upward for at least the last 10 to 15 candles and that price has closed above it most of that time (reverse everything for shorts).
- Wait for a pullback that reaches or comes close to the 50 MA without a decisive close below it.
- Look for a bullish rejection candle near the average, such as a long lower wick or a bullish engulfing bar.
- Enter on a break of that candle's high, never before the candle has closed.
- Skip the trade if a major resistance level sits just above current price.
Exit and stop
- Place the initial stop below the rejection candle's low or a little below the 50 MA, whichever leaves more room for normal noise.
- Take partial profit at the most recent swing high.
- Trail the rest of the position below the 50 MA or below each new higher low.
- Exit fully after two consecutive daily closes below the average.
Risk notes
In sideways markets the 50 MA flattens and price crosses it again and again; this is where the method suffers most. If the slope is unclear, stand aside. Size each position so that a stop-out costs only a small, fixed share of the account, and remember that a price gap can jump straight past your stop.
Important: This is a sample educational strategy, not a buy or sell recommendation. Test every rule first, with a backtest on historical data and then on a demo account, and decide whether to use or adapt it only after you understand how it behaves in different market conditions.
These strategies need testing (backtesting and a demo account) before use. Any buy or sell decision based on them is at your own risk.