Lesson 6 of 8
Market Profit and Loss Indicators
1. What Is MVRV?
Comparing Market Value with Realized Value
The MVRV ratio shows how a cryptocurrency’s current market value compares with its realized value. In simple terms, it helps us understand how far the current price has moved from the estimated cost basis derived from on-chain data.
To understand it, we first need to define two concepts:
- Market Capitalization (Market Cap): The cryptocurrency’s current price multiplied by its circulating supply.
- Realized Capitalization (Realized Cap): A valuation that prices each unit of the cryptocurrency at the price when it last moved on-chain, rather than at today’s price.
Formula:
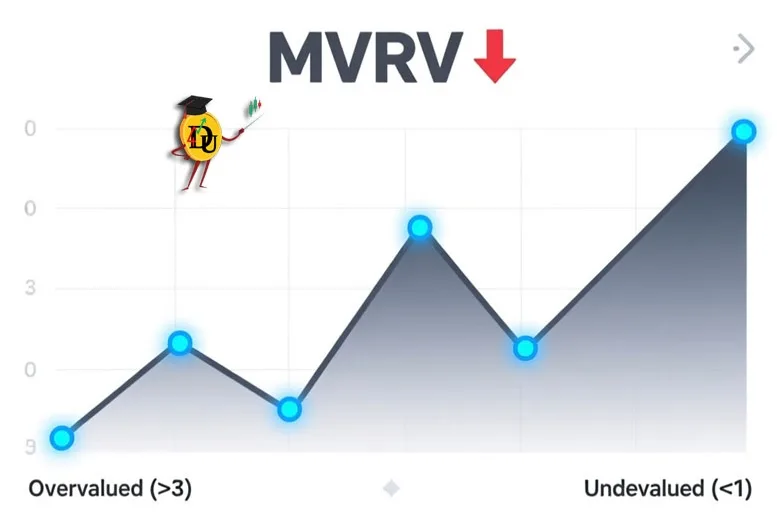
MVRV = Market Cap ÷ Realized Cap
How Is It Interpreted?
- Above 1: Market cap exceeds realized cap, meaning that holdings, in aggregate, are in unrealized profit relative to their estimated cost basis.
- Below 1: Market cap is lower than realized cap, meaning that holdings, in aggregate, are in unrealized loss.
- Close to 1: The market price is close to the estimated aggregate cost basis of the network.
A Simple Example
If Bitcoin’s market cap is 120billionanditsrealizedcapis120 billion and its realized cap is 80 billion, its MVRV ratio is 1.5.
This means the current market value is 50% higher than the realized value. It does not mean that every investor has made exactly a 50% profit.
Historically, very high MVRV readings for Bitcoin have sometimes coincided with overheated markets, while readings below 1 have been associated with periods of market stress and potentially attractive relative valuations. However, a high MVRV does not, by itself, signal an immediate price decline, and a low MVRV does not guarantee a market bottom.
An important limitation is that a coin’s last on-chain movement was not necessarily a purchase. It may have been a transfer between wallets belonging to the same person. Realized cap is therefore an on-chain estimate of cost basis, not an exact record of investors’ purchase costs.
2. What Is the MVRV Z-Score?
Measuring the Gap Between Market Value and Realized Value on a Historical Scale
The MVRV Z-Score measures the difference between market cap and realized cap relative to the historical variability of market cap. Its purpose is to indicate how unusual or extreme that gap is compared with the past.
Common formula:
MVRV Z-Score = (Market Cap − Realized Cap) ÷ Historical Standard Deviation of Market Cap
Here, “standard deviation” measures the dispersion and variability of market cap. You do not need to understand complex calculations to use the indicator at an introductory level. The key idea is that the difference between the two valuations is placed on a historical scale.
How Is It Interpreted?
- Very high readings: Market cap is substantially above realized cap. This can coincide with market exuberance, large unrealized profits, and an increased risk of a correction.
- Low or negative readings: Market cap is close to, or below, realized cap. Historically, such conditions have sometimes occurred during downturns and periods of selling pressure.

How Does It Differ from MVRV?
MVRV expresses the ratio between two valuations. The Z-Score, by contrast, attempts to measure the magnitude of the gap relative to the historical variability of market cap.
For this reason, it is generally more useful for understanding the broader market cycle than for identifying precise day-to-day entry and exit points.
The colored zones or thresholds shown on different charts may vary depending on the calculation method and the historical data used. No reading guarantees that the market is exactly at a top or bottom.
3. What Is NUPL?
Measuring the Market’s Aggregate Unrealized Profit and Loss
NUPL stands for Net Unrealized Profit/Loss.
This indicator measures the share of current market value represented by net profit or loss relative to the coins’ estimated cost basis that has not yet been realized through spending those coins.
Common formula:
NUPL = (Market Cap − Realized Cap) ÷ Market Cap
How Is It Interpreted?
- Positive: The market, in aggregate, is in unrealized profit.
- Negative: The market, in aggregate, is in unrealized loss.
- Close to zero: Market cap and realized cap are approximately equal.

A Simple Example
If market cap is 100billionandrealizedcapis100 billion and realized cap is 70 billion, NUPL is 0.30.
This means net unrealized profit equals 30% of the current market value.
In market-cycle analysis, different NUPL ranges are often labeled with terms such as fear, hope, optimism, and euphoria. These labels are analytical interpretations of market conditions, not direct measurements of every investor’s emotions.
When NUPL becomes very high, the market contains substantial unrealized profits, which may increase the incentive to take profits. A negative reading can indicate widespread financial pressure on holders, but the market may remain in that condition for an extended period.
One practical point is that, under their common definitions, NUPL and MVRV are calculated from the same two variables. Agreement between them therefore does not necessarily provide two fully independent pieces of evidence.
4. What Is SOPR?
Were the Coins That Moved Spent at a Profit or a Loss?
SOPR stands for Spent Output Profit Ratio. It compares the value of coins when they are spent with their value when the corresponding outputs were created.
In simple terms, it asks: Were the coins now being spent on-chain in profit or in loss relative to their previous estimated cost basis?
Simplified formula:
SOPR = Value of Spent Coins at the Time of Spending ÷ Value of Those Same Coins When Their Outputs Were Created
How Is It Interpreted?
- Above 1: The spent coins moved at an aggregate profit.
- Below 1: The spent coins moved at an aggregate loss.
- Equal to 1: Their value at the time of spending was approximately equal to their previous estimated cost basis.

A Simple Example
Suppose a Bitcoin output was created when the price was 50,000andspentwhenthepricewas50,000 and spent when the price was 60,000.
The SOPR for that output would be 1.2, meaning it moved at a value 20% above its estimated cost basis.
In bullish markets, a return of SOPR to around 1 sometimes indicates that profit-taking has eased and the coins being spent are near their break-even level. In bearish markets, SOPR remaining below 1 can indicate continued spending at a loss.
However, not every on-chain movement is a sale. Transfers between a person’s own wallets may also appear in the data. Versions such as aSOPR, or Adjusted SOPR, filter out certain very short-lived outputs to reduce some of this noise.
5. What Are Realized Profit and Realized Loss?
Measuring the Dollar Value of Profit and Loss on Spent Coins
The Realized Profit and Realized Loss metrics measure how much profit or loss coins spent during a given period have recorded relative to their previous estimated cost basis.
For each coin amount, the difference between the price at the time of spending and the previous cost-basis price is multiplied by the quantity of coins.
- If the difference is positive, realized profit is recorded.
- If the difference is negative, realized loss is recorded.
A Simple Example
If one bitcoin has an estimated cost basis of 40,000andisspentwhenthepriceis40,000 and is spent when the price is 55,000, the on-chain data records $15,000 in realized profit.
If it is spent at 35,000,thedatarecords35,000, the data records 5,000 in realized loss.
What Can These Metrics Tell Us?
- A spike in realized profit: May coincide with increased profit-taking.
- A spike in realized loss: May indicate loss-making investors exiting, selling pressure, or capitulation by part of the market.
- Net realized profit/loss: Is calculated by subtracting realized loss from realized profit.
How Do They Differ from SOPR?
SOPR is a ratio, while realized profit and realized loss measure the amount of profit or loss, usually in dollar terms.
An increase in realized profit is not always bearish. Strong demand may absorb the supply, allowing prices to continue rising. Similarly, an increase in realized loss does not, by itself, prove that a decline has ended.
Here, too, “realized” is an on-chain term. It does not necessarily mean that an actual sale occurred, cash was received, or a taxable profit or loss was recognized by the individual.
6. What Is Realized Price?
The Network’s Average Estimated Cost Basis
Realized Price is calculated by dividing realized cap by circulating supply:
Realized Price = Realized Cap ÷ Circulating Supply
This indicator can be viewed as a quantity-weighted average of the estimated cost basis of coins across the network, using the price at which each coin last moved.
How Is It Interpreted?
- Market price above realized price: The network, in aggregate, is in unrealized profit.
- Market price below realized price: The network, in aggregate, is in unrealized loss.
A Simple Example
If Bitcoin’s realized price is 45,000anditsmarketpriceis45,000 and its market price is 54,000, the current price is 20% above this estimated cost basis.
Historically, Bitcoin’s realized price has sometimes been an important level during bearish market cycles. Analysts therefore monitor how the market reacts around it. However, it is not a guaranteed support level, and the price may remain below it for some time.
Separate realized prices can also be calculated for different groups, such as short-term and long-term holders, to assess each group’s position more precisely.
7. What Are Short-Term and Long-Term Holder Profit/Loss Ratios?
Comparing the Positions of Two Important Market Groups
In many Bitcoin on-chain datasets, coins are divided into two groups based on how much time has passed since their last movement:
- Short-Term Holders (STH): Generally, coins younger than approximately 155 days.
- Long-Term Holders (LTH): Generally, coins older than approximately 155 days.
This classification is based on coin age, not definitive knowledge of the wallet owner’s identity, personality, or investment strategy. The precise classification method may also vary between data providers.

Each Group’s Realized Profit-to-Loss Ratio
One common metric compares the realized profit and realized loss of coins spent by each group:
Profit-to-Loss Ratio = Group’s Realized Profit ÷ Group’s Realized Loss
Here, realized loss is expressed as a positive loss amount.
- Above 1: Realized profit exceeds realized loss.
- Below 1: Realized loss exceeds realized profit.
- Close to 1: The amounts of realized profit and realized loss are approximately equal.
A Simple Example
If short-term holders record 200millioninrealizedprofitand200 million in realized profit and 100 million in realized loss in one day, their profit-to-loss ratio is 2.
Why Does Comparing These Two Groups Matter?
Short-term holders are generally more sensitive to recent price changes. An increase in their realized losses may indicate that recent buyers are under pressure.
Long-term holders hold coins that have remained unspent for longer. An increase in their realized profits may indicate that some older coins are being spent, potentially reflecting profit-taking.
However, the term “holder profit/loss ratio” does not always refer to one specific indicator. Some charts display STH-SOPR and LTH-SOPR, while others show the ratio of realized profit to realized loss. These metrics are related, but they are not identical, so the chart’s definition should be checked.
Also, if recorded losses are very small, the profit-to-loss ratio can become extremely large. It is therefore important to examine the actual amounts of profit and loss, not just the ratio.
Simple Summary
- MVRV: How many times larger is current market value than realized value?
- MVRV Z-Score: How extreme is the gap between these two valuations on a historical scale?
- NUPL: What share of market value represents net unrealized profit or loss?
- SOPR: Did spent coins move at an aggregate profit or loss?
- Realized Profit and Realized Loss: How much profit or loss was recorded on those movements?
- Realized Price: Where is the network’s average estimated cost basis?
- STH and LTH Metrics: How do the profit and loss positions of short-term and long-term coins differ?
Disclaimer
This article is intended solely for educational purposes and to introduce on-chain analysis. It does not constitute a recommendation to buy or sell. None of these indicators provides a definitive signal on its own; they are best assessed alongside price trends, trading volume, and broader market conditions.
This lesson is for education only and is not a recommendation to buy or sell any asset.